Every year the National Center for Science and Engineering Statistics conducts a census of persons who received a doctorate degree, call the Survey of Earned Doctorates. Over the years, the survey provides a unique view into trends in educating doctoral degree scholars in the country.
The 2022 results were recently released in a report, accompanied by detailed tables. For those of us who focus day-to-day on our own graduate programs, it’s useful from time to time to see national trends.
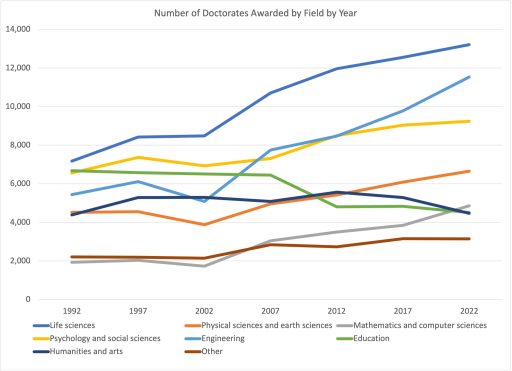
The first important result is that the number of doctorate recipients tends to increase year over year. For example, in 2022 there were roughly 58,000 new doctorate recipients, compared to roughly 39,000 in 1992. It is important to note that the 2022 increase followed two years of decline, probably pandemic-affected. The greatest increases in recent years occur in the life sciences, especially biomedical PhD’s, and also those in engineering. In contrast to these two fields, Education doctorates and doctorates in the Humanities and the Arts, show lower or no increases over recent years.

The 2022 survey added some questions about perceived effects of the pandemic on the respondent’s progress toward degree. Over two-thirds of the respondents reported that their doctoral research was disrupted by the pandemic. About half of the respondents noted that this disruption slowed their completion of the degree. Those fields whose research is dependent on laboratories, studios or other facilities reported the highest disruption of their progress. In contrast, those in fields that don’t require such physical facilities reported less disruption (e.g., mathematics and computer science). Despite these reports, over the years, the overall time to degree among these doctorate recipients show no large increases. Indeed, there is some evidence that the PhD time to degree is shorter in 2022 than in prior years.
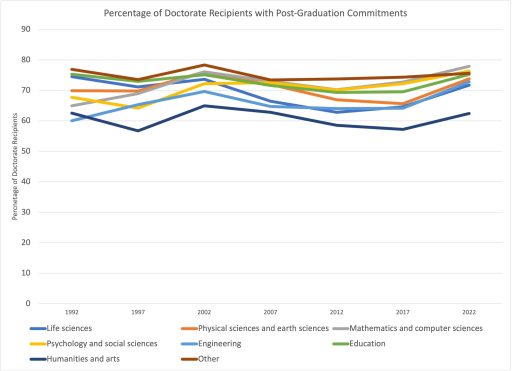
Another issue of preeminence importance to both faculty and students in PhD programs is the employment outcome of the programs. The survey asked the respondents to report whether upon receipt of the degree they had a commitment for employment, including a postdoctoral fellow appointment. The chart below again compares different fields over time. Roughly 65-75% of all doctorate recipients report having a job commitment. Further, there is an increase in these percentages overall between the 2017-2022. However, there are field differences. Quite consistently, the doctorate recipients in the humanities and arts have lower job commitments upon completion of their programs.

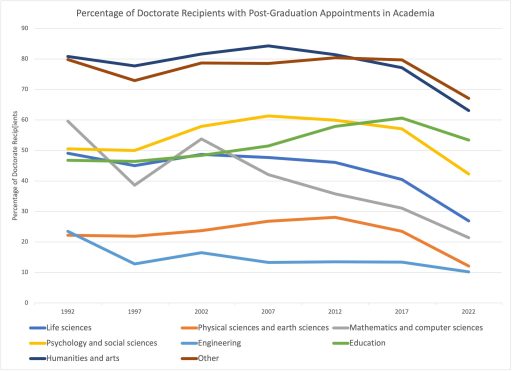
What kinds of jobs are the new doctorate recipients taking? Universities and colleges form a traditional sector of employment of PhD’s. The chart below shows an overall decline in the percentage of academic appointments for new PhD’s between 2017 and 2022. That is, employment of PhD’s is spreading to nonacademic locations.
The trends below show very large field differences in the tendency to have academic employment. The lowest percentages employed in academia are for fields of engineering as well as the physical and earth sciences. PhD’s from these fields disproportionately work in research and development positions in private industry. In contrast, the humanities and arts new PhD’s are employed in academia post-graduation at very high percentages, near 80%. (Note that the “Other” category also tends to be employed in academia; these include among others PhD’s in business administration.).

But even those fields traditionally hired by universities are seeing shifts. For example, while only 4% of humanities and arts new PhD’s were hired by the private sector in 1992, by 2022 the percentage was 11%.
The overall findings over time of lower employment rates in academia are likely to increase as the age distribution of the US suggests lower enrollments in colleges in the future. (See this post.)
The doctoral degree is typically the highest research-oriented degree offered in US universities. Our country continues to produce new PhD’s in high numbers but the growth in biomedical and engineering PhD’s suggest that the production is linked to demand from private sector firms. There is never a perfect match between demand for PhD’s in a given field and the production of new PhD’s in that field. For practical and ethical reasons, it behooves all of us to examine data like those from the Survey of Earned Doctorates.

Your exploration of ‘WHAT’S HAPPENING WITH US PRODUCTION OF DOCTORATES’ sheds light on the current state and trends in doctoral production in the United States. It’s fascinating to see an analysis of the dynamics and factors influencing the production of doctorates. This information is crucial for understanding the educational landscape and the potential implications for the future. Thank you for providing insights into this important aspect of academic development
The production of doctorates in the United States is undergoing notable shifts. Changes in research funding, academic priorities, and career trajectories are influencing the landscape of doctoral education. As institutions adapt to these dynamics, there is a growing emphasis on interdisciplinary research, industry partnerships, and preparing doctoral candidates for diverse career paths beyond academia. Understanding these trends is essential for stakeholders in higher education as they navigate the evolving landscape of doctoral education in the United States